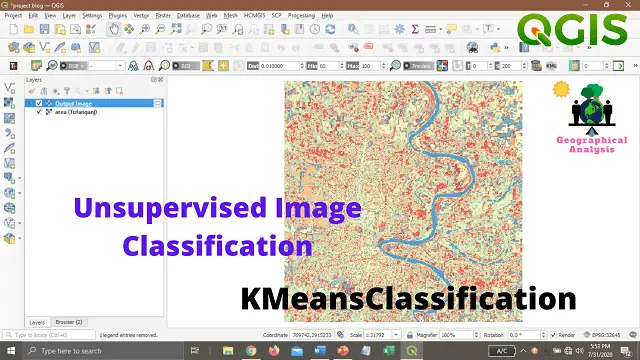
Unsupervised classification is done on software analysis. It uses computer techniques to determine the pixels which are related and group them into classes. Now in this post, we are doing unsupervised image classification using KMeansClassification in QGIS.
Before doing unsupervised image classification, it is very important to learn and understand the K-Means clustering algorithm.
Introduction to K-Means Clustering
The first property of clusters – the points or things within a cluster should be similar to each other or of the same kind.
K-Means Clustering is an algorithm that tries to minimize the distance of the points in a cluster with their centroid – the k-means clustering technique. K-Means Clustering is a simple yet powerful algorithm in data science.
The main objective of the K-Means algorithm is to minimize the sum of distances between the points and their respective cluster centroid.
Let’s now take a basic example to see how the K-Means Clustering algorithm really functions:

We have 8 points, and we want to apply k-means to create clusters for these points. Let’s see how we can do it.
Step 1: Pick the number of clusters k
The first step in k-means is to choose the number of clusters, k.
Step 2: Select k random points from the data as centroids
Next, we randomly select the centroid for each cluster. Let’s say we want to have 2 clusters, so k is equal to 2 here. We then randomly select the centroid:
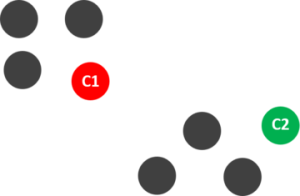
Here, the red and green circles represent the centroid for these clusters.
Step 3: Assign all the points to the closest cluster centroid
Once we have initialized the centroids, we assign each point to the closest cluster centroid:
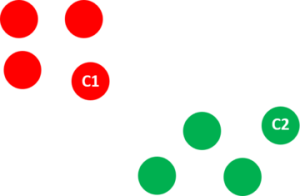
Here you’ll see that the points which are closer to the red point are assigned to the red cluster, whereas the points which are closer to the green point are assigned to the green cluster.
Step 4: Recompute the centroids of newly formed clusters
Now, once we have assigned all of the points to either cluster, the next step is to compute the centroids of newly formed clusters

Here, the red and green crosses are the new centroids.
Step 5: Repeat steps 3 and 4
We then repeat steps 3 and 4:
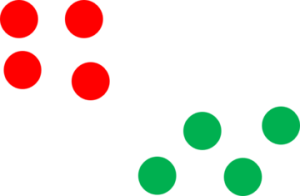
The step of computing the centroid and assigning all the points to the cluster supported by their distance from the centroid may be a single iteration. But wait – when should we stop this process? It can’t run till eternity, right?
Stopping Criteria for K-Means Clustering
There are essentially three stopping criteria which will be adopted to prevent the K-means algorithm:
- Centroids of newly formed clusters don’t change
- Points remain within the same cluster
- The maximum number of iterations is reached
We can stop the algorithm if the centroids of newly formed clusters aren’t changing. Even after multiple iterations, if we are becoming an equivalent centroid for all the clusters, we will say that the algorithm isn’t learning any new pattern and it’s a symbol to prevent the training.
Another clear sign is that we should always stop the training process if the points remain within the same cluster even after training the algorithm for multiple iterations.
Finally, we will stop the training if the utmost number of iterations is reached. Suppose we’ve set the number of iterations as 100. the method will repeat for 100 iterations before stopping.
Unsupervised classification using KMeansClassification in QGIS
Now we will see the steps for Unsupervised Classification on QGIS software. Let’s follow the steps.
- Add a raster layer in a project Layer >> Add Layer >> Add Raster Layer.
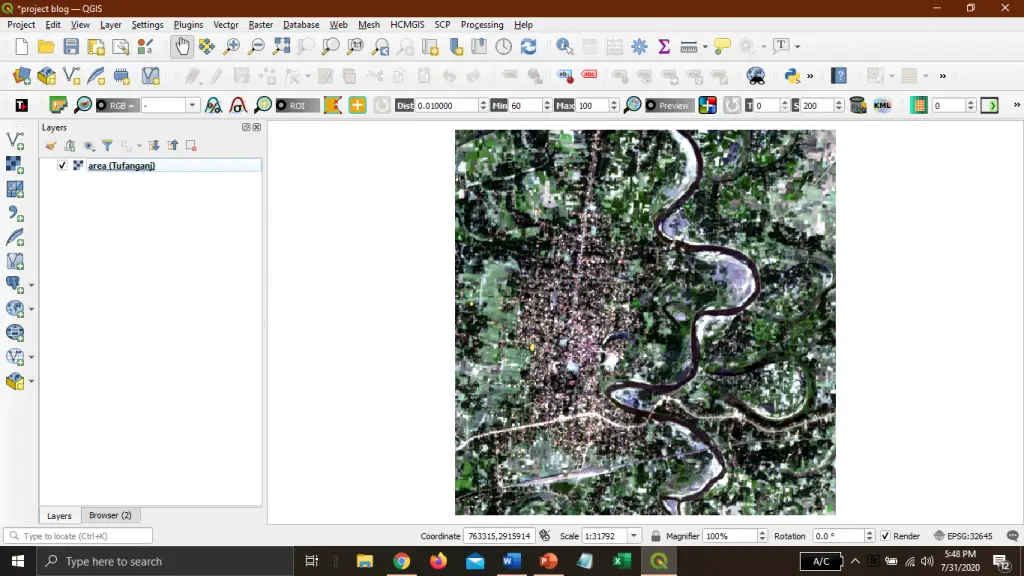
- Click on the menu toolbar Processing >> Toolbox >> OTB >> Learning >> KMeansClassification.

- Select the input image. Type the number of classes to 20 (default classes are 5). Fill training size to 10000.
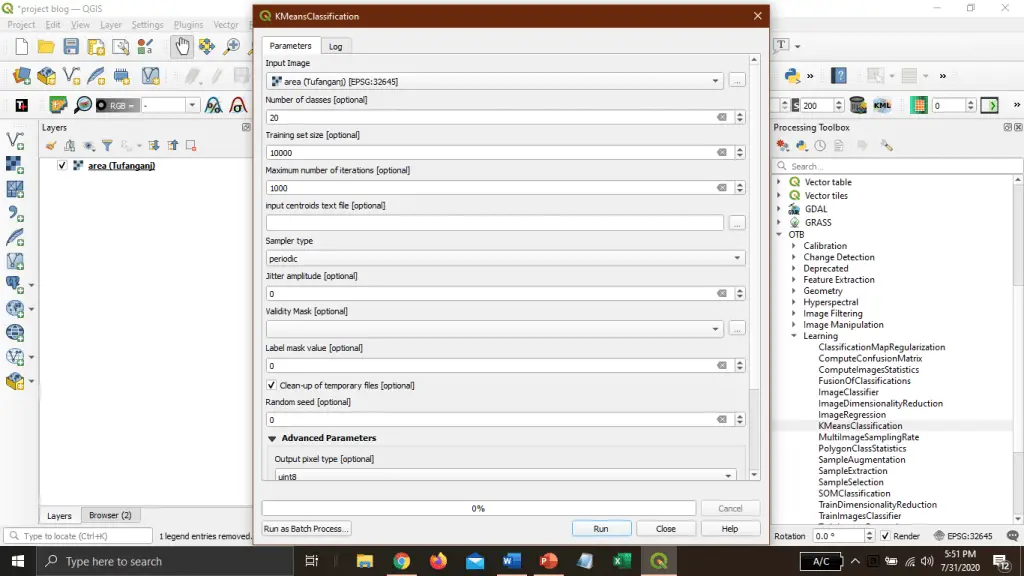
- Output pixel type unit8. (you can skip it)
- Output image Save to File.
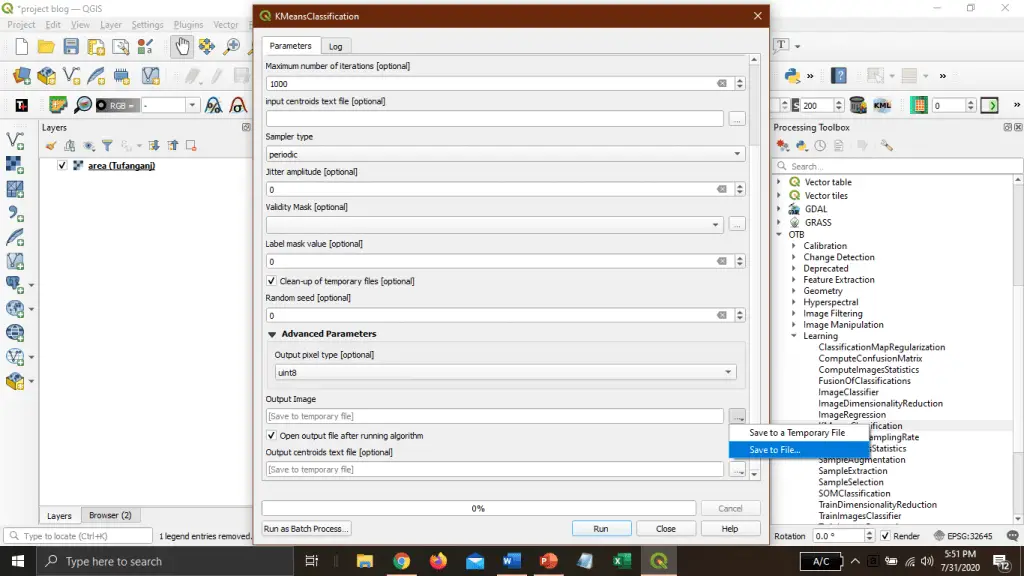
- Click on Run. (it will take a little bit of time). After completion, a new output layer will be added to the layer.
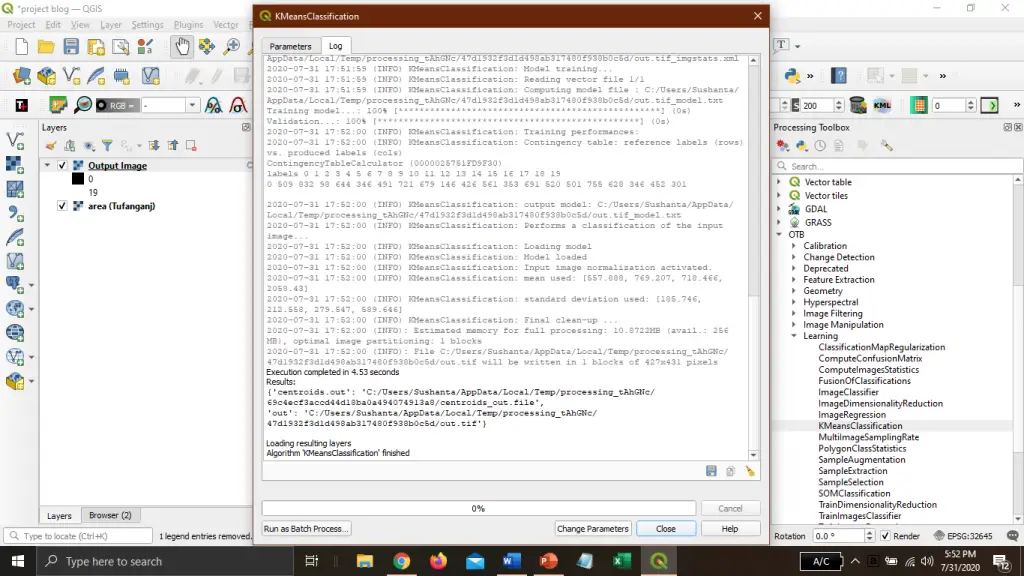
- Close it.
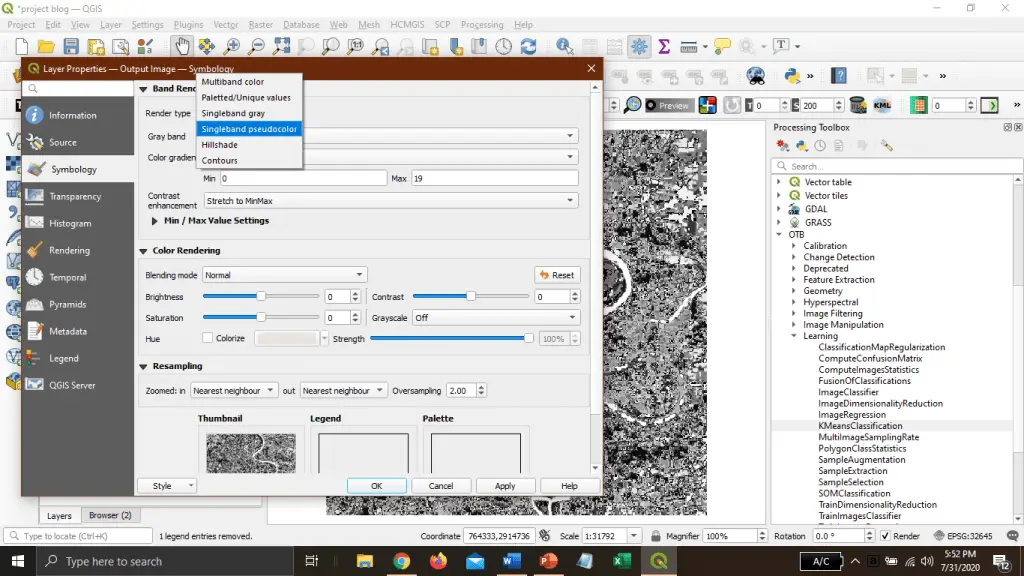
- To change the symbology, open Properties of Output Image.

- From symbology, select render type Single-band Pseudocolor.
- Scroll down and click on Classify. Select Mode Equal Interval. Set classes 20.
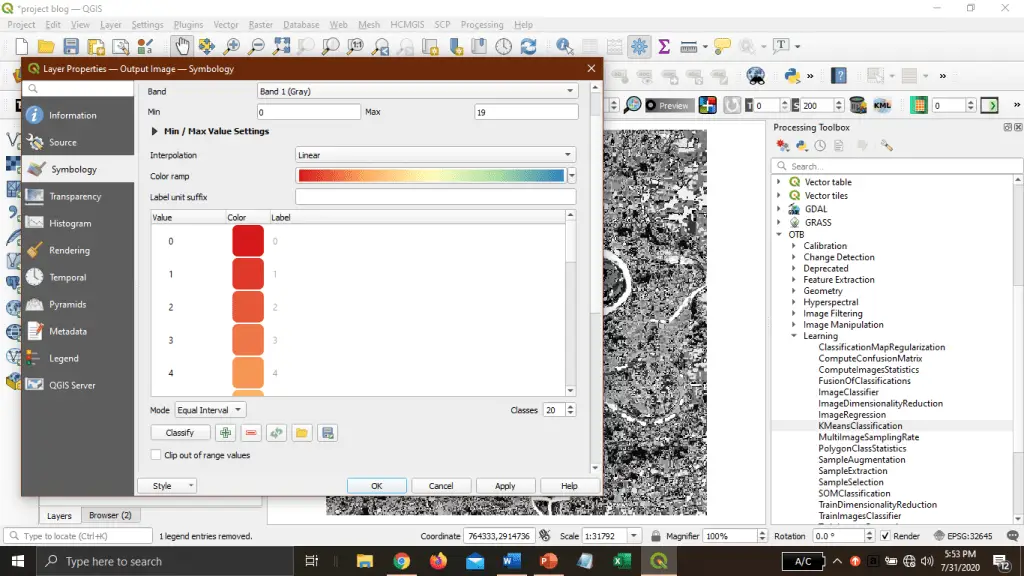
- Click Apply and then click on OK.
That’s it.
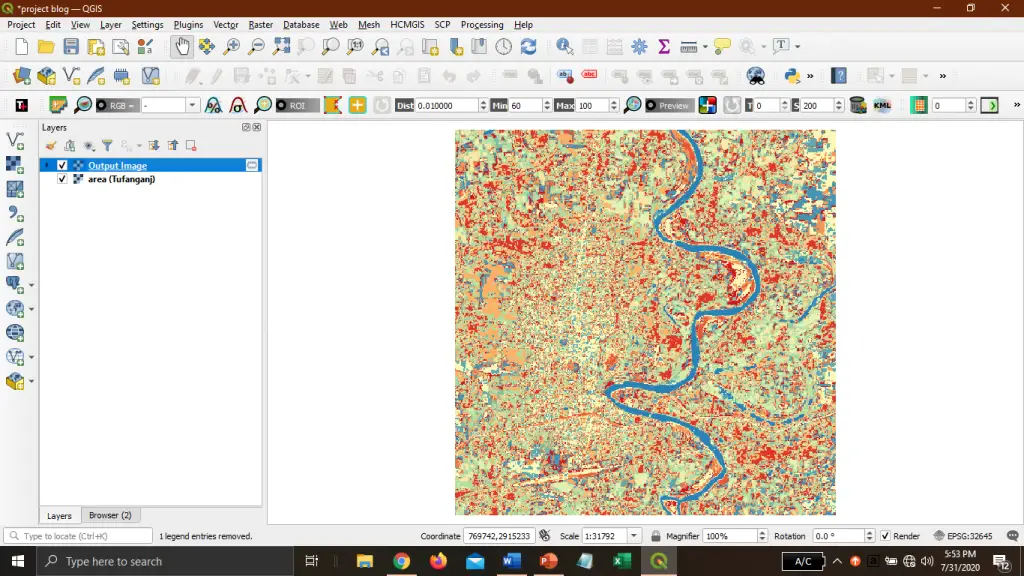
Finally, we did Unsupervised Classification using KMeansClassification in QGIS. If you face any problem regarding this, comment below. Raster image and output file download links are also available. You can download it from here.
Download:
Raster Image > Area(Tufanganj)> Click Here
Output Image > Click Here
